Overview
Engagement Score is Disco’s composite measure of how active a member is across the Academy. The Engagement Report is the home for that score. From this page you can adjust the weights that drive the calculation, view a sortable table of every member’s score, watch the trend over time, and dig into the activity signals that feed it. Use it to define what “engaged” means for your Academy and to keep an eye on whether members are trending in the right direction.Before you start
- You need Admin access to view and edit the Engagement Report.
- Engagement Score is a per-member score that updates as members take action across the Academy.
- The Activity Insights widgets honor the date filter at the top of the section.
Open the Engagement Report
- Go to the Admin Area.
- Open the Insights section in the left navigation.
- Select Engagement.
Edit Engagement Score weights
Weights determine how much each type of activity contributes to a member’s Engagement Score. For example, you can decide whether a comment is worth more than a reaction, or whether finishing a curriculum section should outweigh attending an event.- From the Engagement Report, locate the Engagement Score card at the top of the page.
- Select Edit Weights.
- Adjust the weight assigned to each activity type.
- Save your changes.
Filter Activity Insights by date
The Activity Insights section is scoped by the date filter at the top.- Select the Date Filter chip.
- Choose a preset range, or set a custom range.
- Every widget below refreshes to reflect the selected window.
Read the Activity Insights widgets
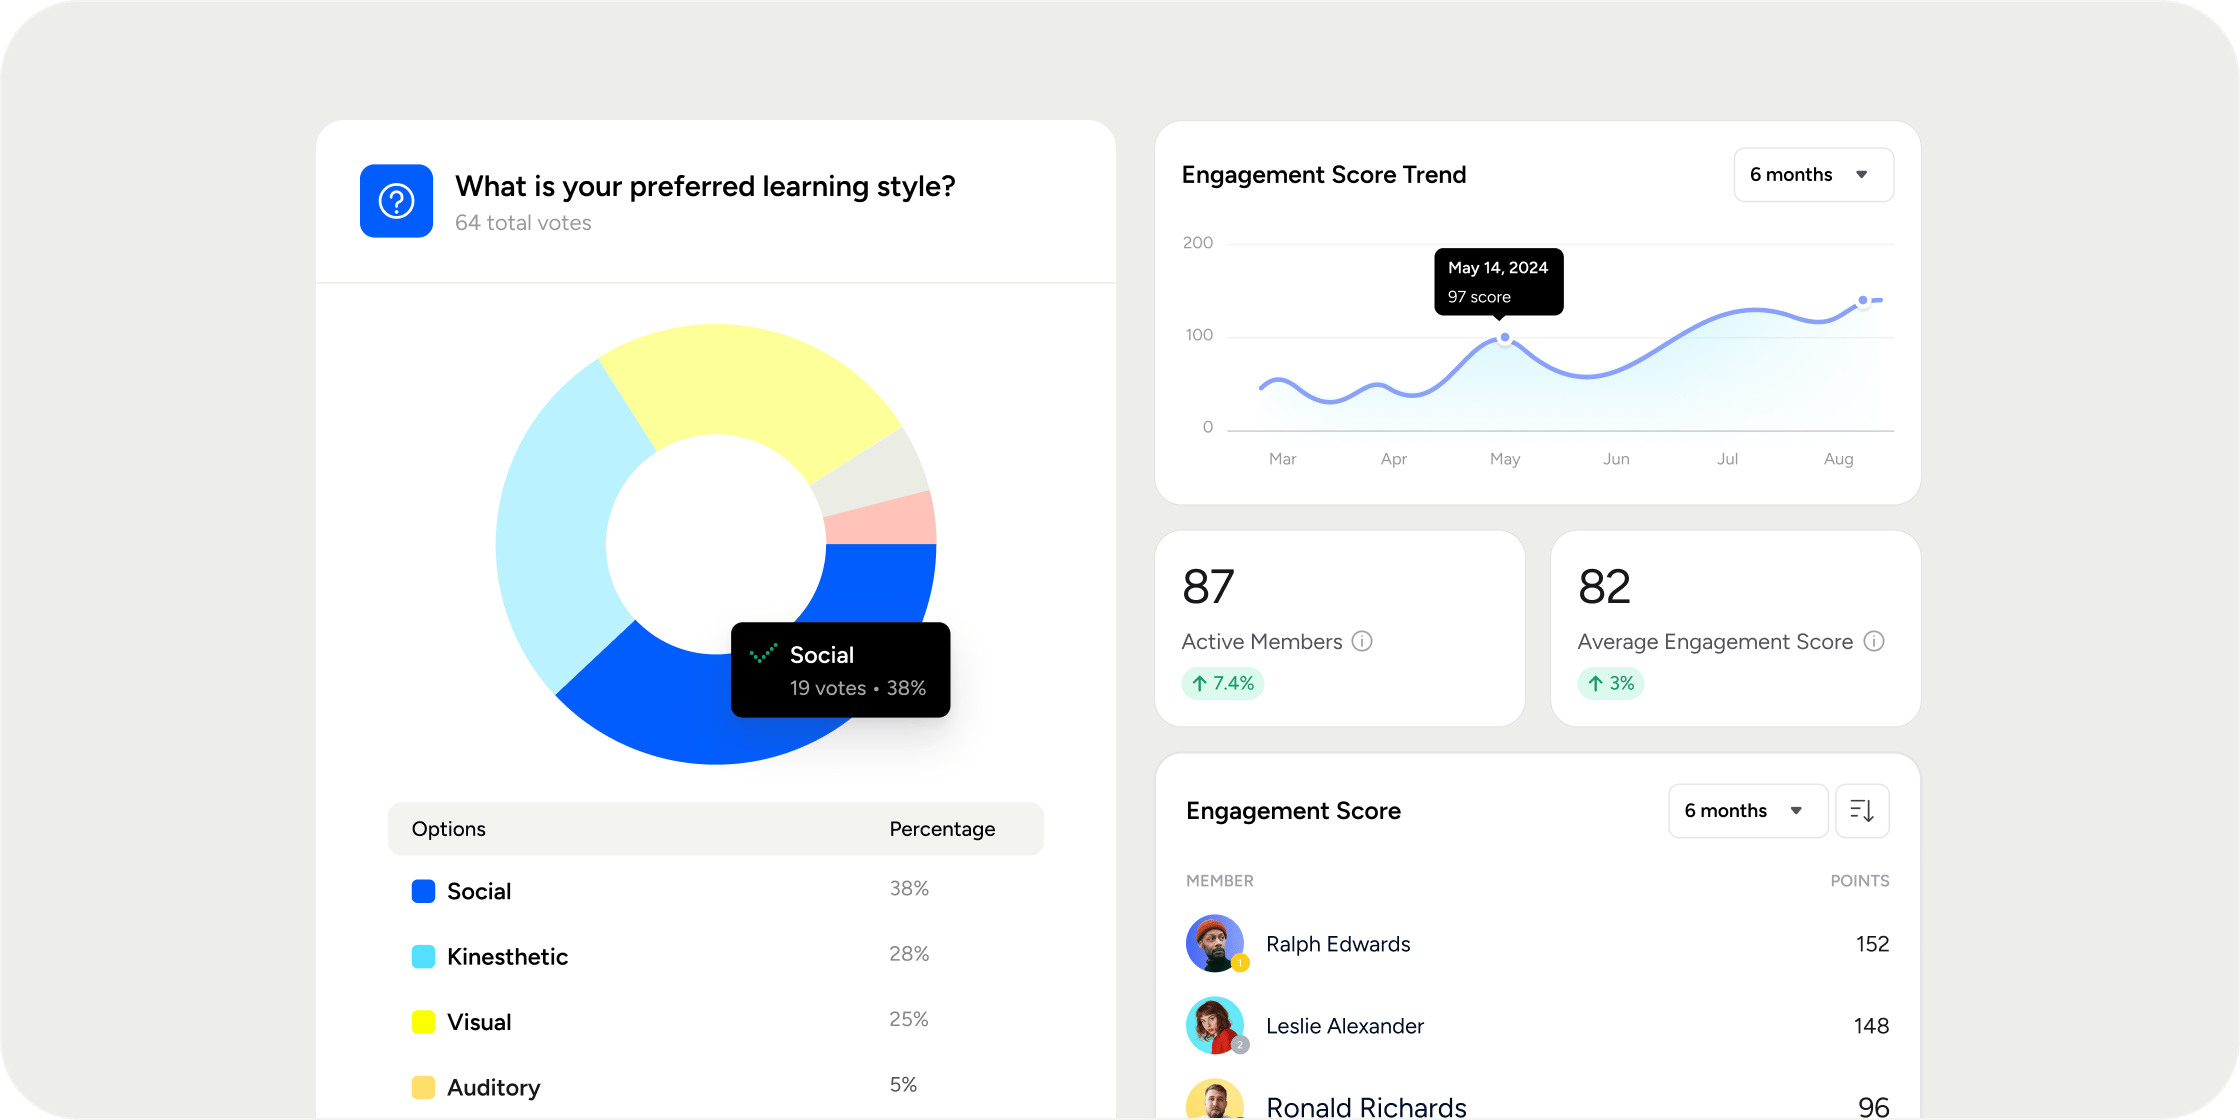
The Activity Insights section shows multiple widgets that surface engagement signals across the Academy. Each widget has an overflow menu (…) for widget-level actions.Engagement Score
A table of every member’s Engagement Score for the selected date range. Columns include Name, Email, Overall Score, and breakdown columns such as Curriculum Sections Completed. Click any column header to sort, and use the table to spot top performers or members who may need outreach.Engagement Score Trend
A line chart showing the Engagement Score over time. Use it to confirm whether your Academy is trending up, down, or flat. Hover the info icon (i) for details on how the score is calculated.Reactions
A view of reactions left across the Academy in the selected date range. Use it to see how members are responding to posts and content.Top Reactions
The reaction emojis used most often by members in the selected date range. Use it to read the emotional tone of your Academy.New Bookmarks
A bar chart of new bookmarks created over the selected date range. Bookmarks are an opt-in signal that a member found a piece of content valuable enough to revisit, so a rising bookmark count usually indicates content that is landing.Export the Engagement Report
To download Activity Insights data, use the export icon at the top right of the Activity Insights section. The export includes the data for the selected date range.FAQ
Can I filter the Engagement Report by group?
Can I filter the Engagement Report by group?
Today the page is scoped by the date filter only. To pull engagement scoped to a single group or sub-group, use the Group Report or filter a Product Report by sub-group, both of which surface engagement metrics.
Can I export the Engagement Report?
Can I export the Engagement Report?
Yes. Use the export icon at the top right of the Activity Insights section. The export reflects the date range you have applied.
Is Engagement Score available in Zapier or via the API?
Is Engagement Score available in Zapier or via the API?
Engagement Score is not currently available as a trigger or field in the Zapier integration, and direct API support for the score is limited. For automated downstream use, export the report manually until first-class API or Zapier support is added.
Can I see leaderboard standings for a previous month?
Can I see leaderboard standings for a previous month?
The Engagement Report shows current data filtered by your selected date range, including past windows. For a snapshot of who topped a leaderboard in a specific previous month, set the date filter to that month and sort the Engagement Score table by Overall Score.
Why is Last Active different across reports for the same member?
Why is Last Active different across reports for the same member?
Different reports reflect different scopes (Academy-wide activity, Program-specific activity, member directory activity), so timestamps can vary. If the gap looks unreasonably large, contact support and share the specific member and the reports you are comparing.